SPIRE VCV CORPUS
About
- SPIRE VCV is a database of speech production that includes simultaneous acoustic and electromagnetic articulography data collected from speakers of non-native/Indian English.
- The stimuli comprise of non-sense symmetrical VCV (Vowel-Consonant-Vowel) utterances as part of the sentence "Speak VCV today" in three different speaking rates: slow, normal, and fast with 3 repetitions each.
- The VCV utterances consist of the combination of 17 consonant sounds namely:
C = { /b/, /ch/, /d/, /f/, /g/, /jh/, /k/, /l/, /m/, /n/, /ng/, /p/, /r/, /s/, /t/, /v/, /z/ } - And 5 vowel sounds:
V = { /a/, /e/, /i/, /o/, /u/ } - 10 non-native English speakers (5 males, 5 females), aged 18–27 years, with no speech-related disorders.
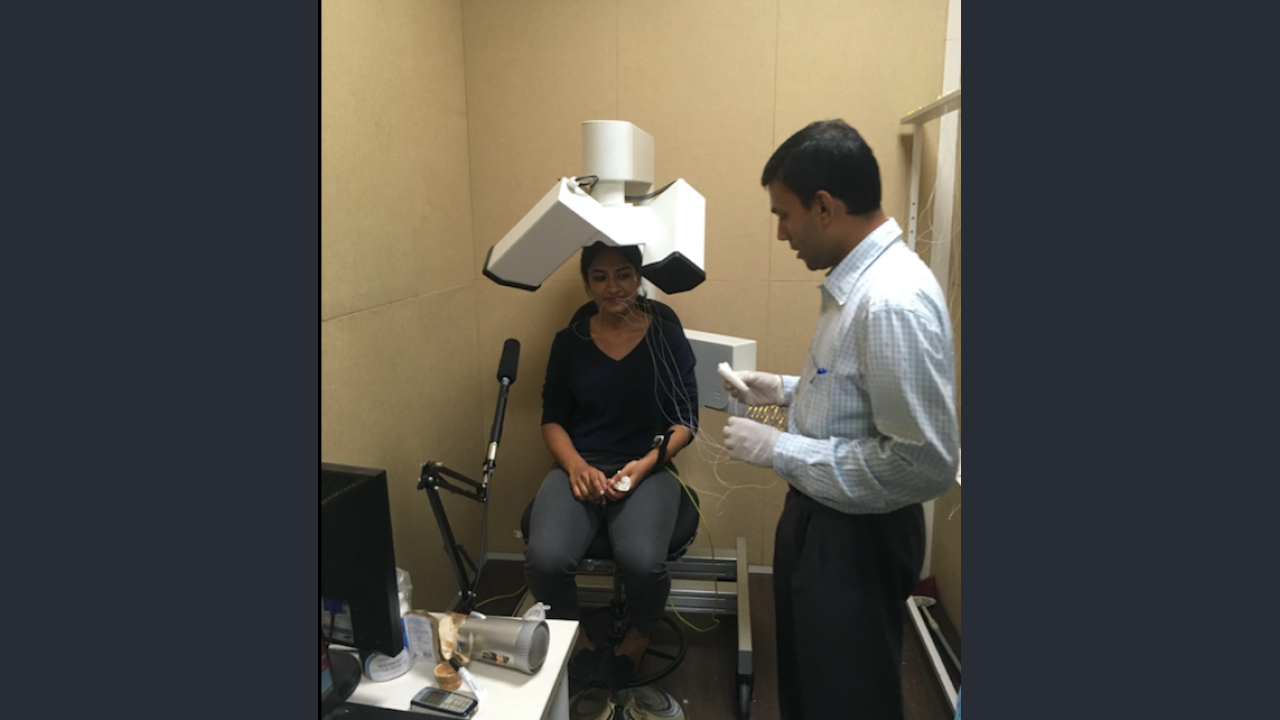
- Recordings were made in the sound damped studio at the SPIRE Labs speech recording facility. Acoustic and articulatory data were recorded directly to the computer and carefully synchronized.
- VCV boundaries were manually annotated. Read more
|
|

|
Recording and Setup
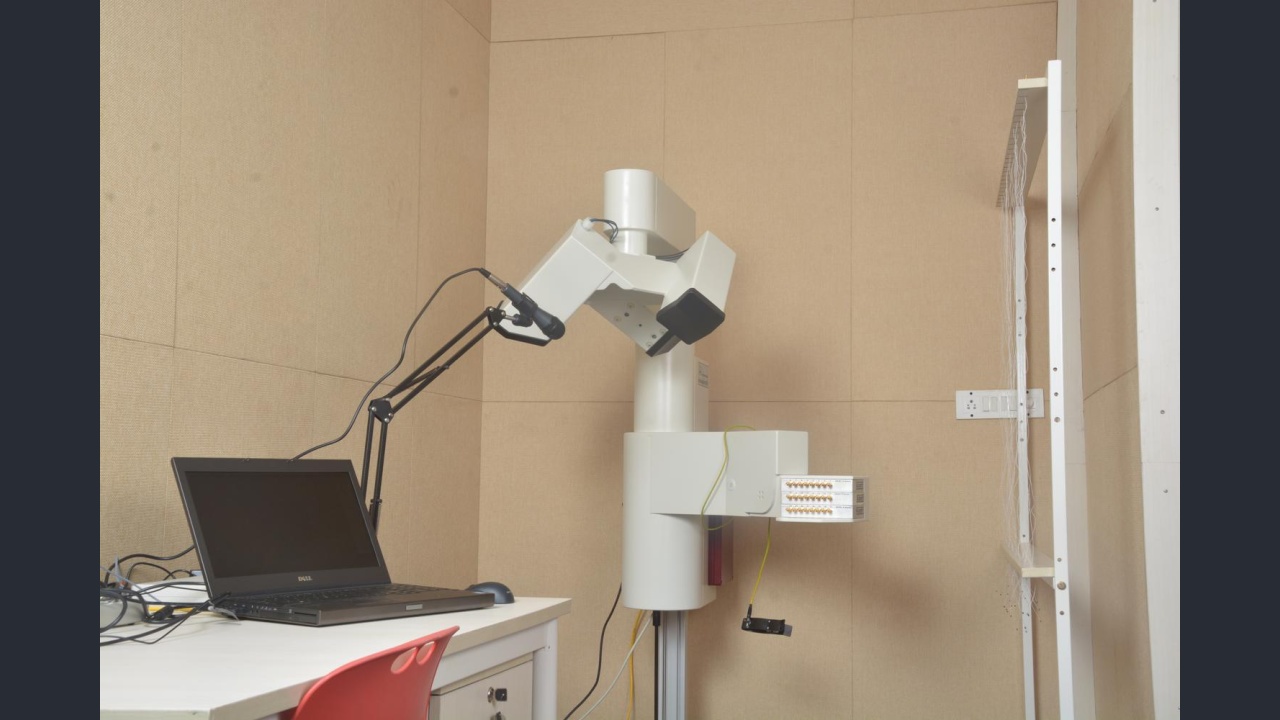
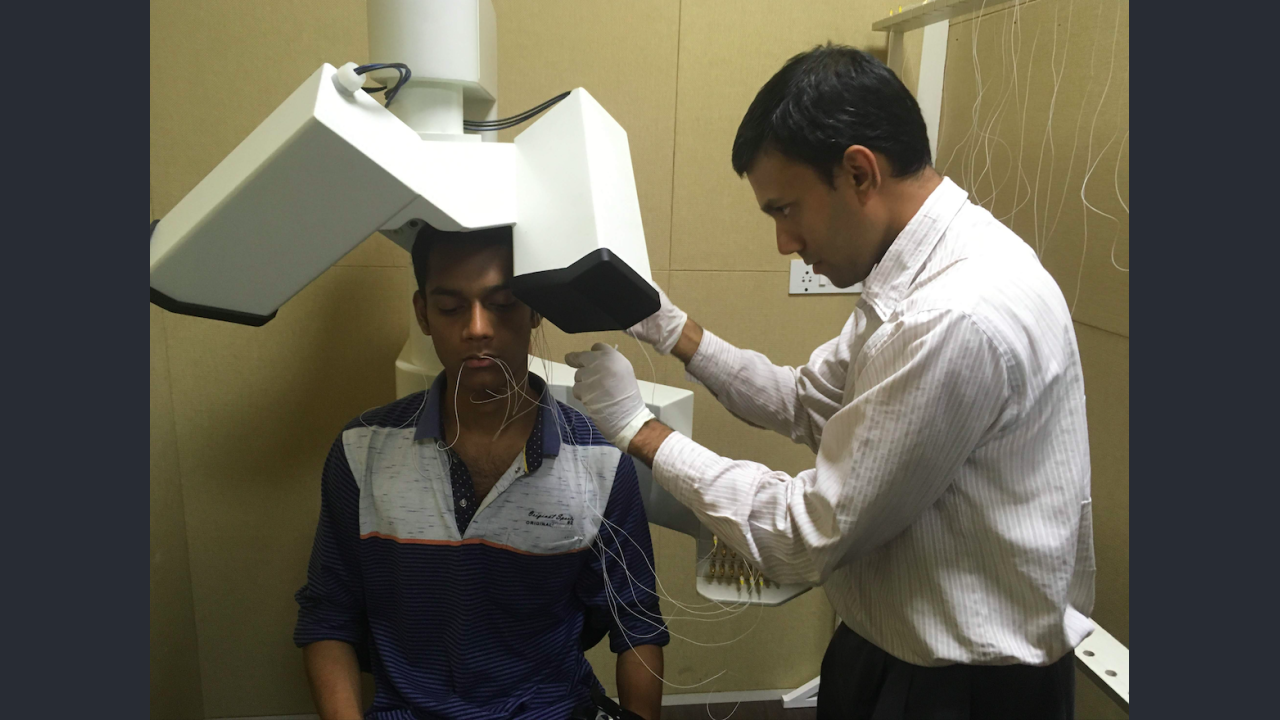
- Articulatory movements were recorded using a 3D Electromagnetic Articulograph. (EMA) AG501.
- A t.bone EM9600 shotgun unidirectional electret condenser microphone was placed near the subject to record the audio data synchronously with the articulatory data.
- Audio:
- originally recorded at 48 kHz then downsampled to 16 kHz.
- Articulatory data:
- Sampled at 250 Hz.
- A 10th-order lowpass Chebyshev Type II filter with 40Hz cut-off frequency and 40 dB of stopband attenuation was used to low-pass filter the articulatory movement recording to eliminate the high-frequency noise resulting from EMA measurement error.
- Sensor placement
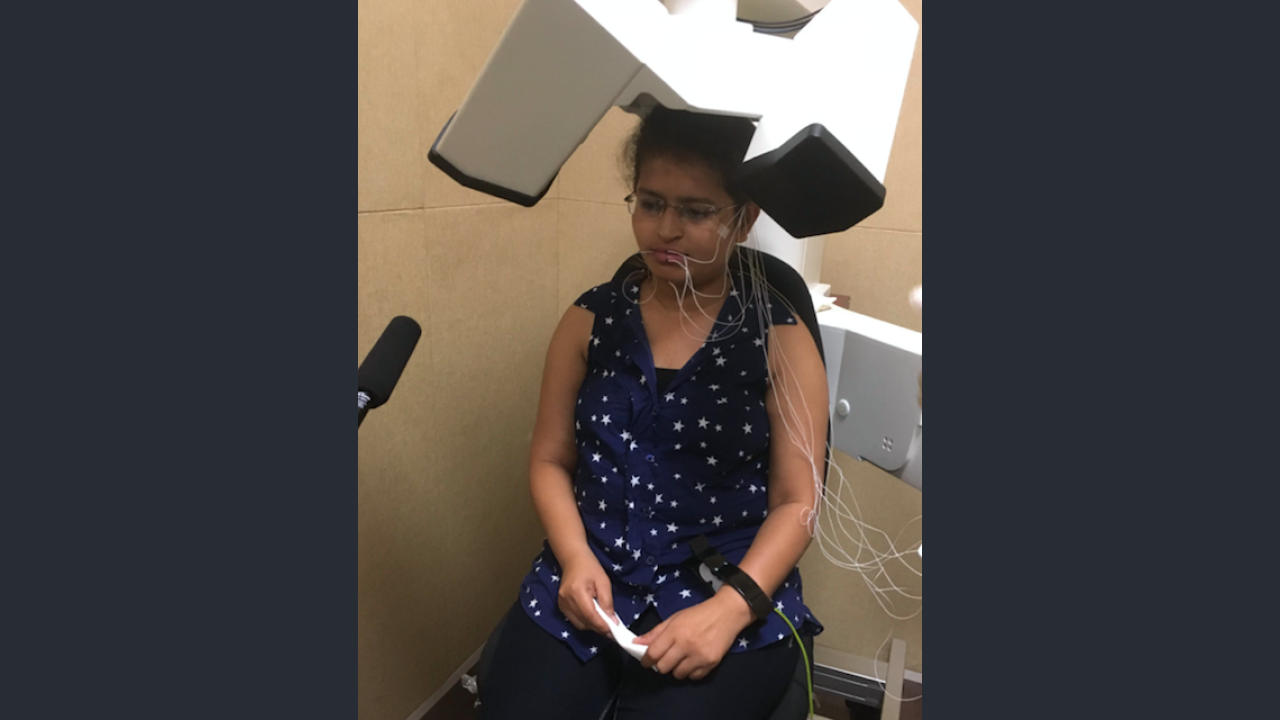
- 6 sensors were placed on the different speech articulators namely:
- Upper Lip
- Lower Lip
- Jaw
- Tongue Tip
- Tongue Body
- Tongue Dorsum
- Sensors were also placed behind the left and right ear for the purpose of head movement correction.
- Each of these 6 sensors captures the movements of the articulators in 3D space, resulting in eighteen articulatory features
- Instructions to speaker:
- All speakers were college going students fluent with reading, writing and speaking English coming from different regions of India with different native language backgrounds.
- Speakers were given prior training to increase speaking rate gradually during the main recording.
- A GUI produces the stimuli to be uttered on screen and the user pronounces it for each of the three different speaking rates, namely slow, normal/habitual, and fast and three repetitions each.
- VCV Boundary annotation:
- The VCV boundaries were manually annotated by a team of four members.
- These boundaries were marked using an in-house built MATLAB annotation tool by observing the wideband spectrogram, the raw waveform and glottal pulses obtained using praat.
- For unvoiced consonants: the last glottal pulse in the V1 region was considered for marking the onset of the C region, and the first glottal pulse at the start of V2 region was for considered marking the end of C-region, in tandem with the spectrogram.
- For voiced consonants: the spectrogram with the formants and time domain waveform were considered for marking the consonant start and end boundaries.
- For ambiguous cases, a unanimous call was then taken for the boundary marking after an internal discussion among the annotators.
Speaker Information
| # | Subject | Age | Gender | Native Language |
| 1 | F1 | 22 | Female | Bengali |
| 2 | M1 | 21 | Male | Tulu |
| 3 | F2 | 27 | Female | Bengali |
| 4 | M2 | 20 | Male | Bengali |
| 5 | F3 | 23 | Female | Tamil |
| 6 | M3 | 21 | Male | Tamil |
| 7 | F4 | 20 | Female | Kannada |
| 8 | M4 | 23 | Male | Tamil |
| 9 | F5 | 21 | Female | Malayalam |
| 10 | M5 | 20 | Male | Hindi |
>>top<<

Minulakshmi Sarath
Publications
Conferences (Accepted and/or Published):
- Tilak Purohit, Achuth Rao M V, P. K. Ghosh,, "Impact of speaking rate on the source filter Interaction in speech: a study", accepted in ICASSP 2021. [PDF] [Poster]
- Tilak Purohit , P. K. Ghosh. , "An investigation of the virtual lip trajectories during the production of bilabial stops and nasal at different speaking rates", accepted in Interspeech 2020, Shanghai, China. [PDF] [Slides] [Presentation]
- Anusuya P, Aravind Illa, P. K. Ghosh,, "A Data Driven Phoneme-Specific Analysis of Articulatory Importance", accepted in International Seminar On Speech Production 2020. [PDF] [Poster]
